Everything so far has quietly assumed that the working substance obeys , and that assumption has to be abandoned before any real machine can be analysed.
Where the ideal gas runs out
The ideal gas model comes from two physical statements: molecules occupy no volume of their own, and they exert no force on one another except during collisions. Both are excellent at low density, because the molecules are then far apart, and both are worthless at high density, because they are then not.
Look at what the model cannot do. Solve for any temperature and any pressure and you always get exactly one answer, a single specific volume that shrinks smoothly as you squeeze. There is no pressure at which the substance suddenly collapses to a thousandth of its volume, so the model has no liquid phase and no condensation. With no condensation there is no boiling, no latent heat, and no critical point at which the distinction between liquid and vapour disappears. A model of matter that cannot boil is not a small idealisation of water. It is a different substance.
The failure lands exactly where engineering lives. A steam power plant boils water at high pressure and condenses it at low pressure, and both processes happen at states the ideal gas model denies exist. A refrigerator does the same with R-134a. Even where the substance is genuinely a vapour, the errors near saturation are large: saturated steam at MPa has a measured specific volume of m³/kg, while with kJ/kg K and K gives m³/kg, an overestimate of fifty per cent.
So is a limiting law, exact only as density goes to zero, and a real substance has to be described by measurement instead. What follows is the geometry those measurements have.
The p-v-T surface and its shadows
For a pure substance , and are tied by one relation, so the accessible states form a two-dimensional surface in -- space rather than filling the volume. Every equilibrium state of water is a point on one particular surface, measured once and for all.
That surface is awkward to draw, so it is used through its two shadows. Project it onto the - plane, looking along the volume axis, and every horizontal phase-change line collapses to a single curve, because pressure and temperature do not change while a substance boils. The result is the phase diagram: three regions, solid, liquid and vapour, separated by the sublimation, fusion and vaporisation lines. All three meet at the triple point, which for water sits at K and Pa, the only condition at which ice, water and steam coexist. That point is so reproducible that it defined the kelvin until .
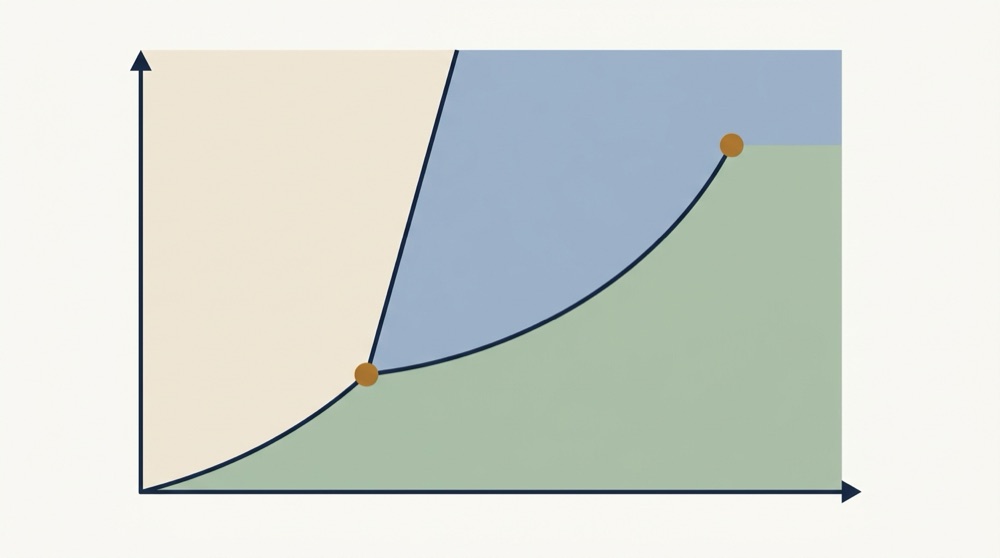
The vaporisation line does not run on forever. It stops at the critical point, at degrees Celsius and MPa for water, first observed for carbon dioxide by Thomas Andrews in . Beyond it liquid and vapour are not distinguishable: the meniscus vanishes, the latent heat falls to zero, and a path that loops around the critical point takes a liquid to a vapour with no phase change anywhere along it. The fusion line, by contrast, has no known end.
Water's fusion line leans the wrong way. For almost every substance it slopes up and slightly to the right, so squeezing a liquid freezes it. For water it slopes up and to the left, because ice is less dense than liquid water ( against kg/m³ near degrees Celsius), so melting a gram of ice makes it occupy less space, not more. Squeezing ice therefore favours the liquid, and the melting point falls with pressure. The magnitude is small: with a specific volume change on melting of about m³/kg and a latent heat of kJ/kg, the slope is roughly K per pascal, so a hundred atmospheres depresses the melting point by less than a kelvin. Enough to make ice float and to let glaciers creep at their beds, nowhere near enough to explain ice skating, which is a friction and surface-layer effect.
The other projection, onto the - plane, keeps what the phase diagram hid. Each phase-change line reopens into a wide region, the saturation dome, bounded on the left by the saturated liquid line and on the right by the saturated vapour line, meeting at the top at the critical point. Inside it, liquid and vapour coexist, and this is the region property tables exist to describe.
Quality, and why two properties are still needed
Inside the dome an isotherm on the - diagram is a horizontal line. Boiling water at kPa stays at degrees Celsius from the first bubble to the last drop, and adding heat only converts more liquid to vapour. So within the dome, pressure and temperature are not independent: knowing one fixes the other. Give me kPa and degrees Celsius and I still cannot tell you the volume or the enthalpy, because I do not know how much of the mass has boiled.
The state postulate is not violated, it is being misread. It demands two independent properties, and here and are one property wearing two hats. The second must distinguish states along the horizontal line, and the natural choice is the quality
the fraction of the total mass that is vapour. It runs from on the saturated liquid line to on the saturated vapour line, and it is meaningless outside the dome.
Because volume is extensive, the mixture's specific volume is the mass-weighted average of the two saturated values and . The total volume is , and dividing by the total mass gives , which rearranges to the form worth memorising:
The same argument works unchanged for internal energy and enthalpy, since those are extensive too, so and , where the subscript denotes the difference across the dome. This one relation, plus a table of and , replaces the equation of state entirely inside the saturation region.
Example. A mixture of liquid water and steam at kPa has a quality of . What is its specific volume, given m³/kg and m³/kg?
Apply the mixing rule directly: m³/kg.
Now you. The same mixture at kPa has a quality of . What is its specific volume, in m³/kg?
Answer
m³/kg.
Reading the tables
Property tables come in two families. Saturated tables list, for each saturation state, the temperature, the corresponding pressure, and the values of , and the internal energies and enthalpies alongside. The identical data is printed twice, once indexed by round temperatures and once by round pressures, purely so that whichever you are given is a row rather than an interpolation. Superheated tables cover states outside the dome, where and are independent again, and are laid out as a block per pressure with temperature running down the rows.
For water at kPa the saturated row reads degrees Celsius, m³/kg and m³/kg. Notice the ratio: the vapour occupies times the volume of the liquid it came from, which is why a boiler is a pressure vessel and a leak is violent.
Between rows, interpolate linearly, which for a smooth property over a small interval is accurate to a fraction of a per cent. Superheated water at kPa is tabulated at m³/kg for degrees Celsius and m³/kg for degrees Celsius. For degrees Celsius the fraction of the way across is , so
The ideal gas value, m³/kg, is per cent high, which is the residual non-ideality of steam a few degrees above its own boiling point.
Interpolation is a convenience, not a physical claim, and it fails wherever the property is not nearly linear: near the critical point, or between widely spaced pressure blocks. Never interpolate across a phase boundary.
A rigid vessel of water
Take a rigid, sealed vessel of volume m³ containing kg of water at kPa. What is inside it?
The first move is always the same: compute the specific volume, which the geometry hands you directly, m³/kg, then compare it with the saturation values at the given pressure. Since , the state lies inside the dome and the vessel holds a saturated mixture at degrees Celsius. Had come out below it would be compressed liquid; above , superheated vapour. That single comparison settles the phase.
The quality follows from the mixing rule, solved for :
So grams of the water is vapour and grams is liquid. The volumes tell the opposite story: the vapour fills m³ and the liquid only m³. Ninety-nine per cent of the vessel is steam while six per cent of the contents is, which is why quality can never be guessed by eye from a sight glass.
Example. A rigid, sealed vessel of m³ holds kg of water at kPa. What phase is inside, and how much of the mass is vapour?
The specific volume is m³/kg. Since , this is a saturated mixture at degrees Celsius. Solving the mixing rule for quality, , so the vapour mass is kg.
Now you. A rigid, sealed vessel of m³ holds kg of water at kPa. What phase is inside, and how many grams of it are vapour?
Answer
m³/kg, which lies between and , so it is a saturated mixture at degrees Celsius. Then , so grams of the water is vapour.
Now heat the vessel. Rigid means constant , sealed means constant , so stays pinned at m³/kg and the state moves vertically up a line of constant specific volume on the - diagram. Pressure and temperature both rise together along the saturation curve, and since our fixed is far to the right of the critical specific volume of water ( m³/kg), the vertical line exits the dome through the saturated vapour side. The quality therefore increases, the liquid level falls, and the last drop evaporates where m³/kg, which the tables place at about MPa and degrees Celsius. Beyond that the vessel holds superheated steam and its pressure climbs steeply.
The direction of that result depends entirely on which side of the critical volume you start. Fill the same vessel with kg of water instead, giving m³/kg, and the vertical line exits through the saturated liquid side: the liquid level rises and the vessel fills completely with compressed liquid, which is how a sealed, over-filled system bursts.
The compressibility factor
Tables are exact but they are also a different book for every substance. A compact alternative starts by asking how badly a gas violates , and calls the answer the compressibility factor
By construction for an ideal gas, where attraction pulls molecules closer than ideal, and where their own volume keeps them apart. Saturated steam at kPa has ; the same steam at MPa has .
The useful discovery, made by van der Waals himself, is that is not a private fact about each gas. Plot against the reduced pressure and the reduced temperature , measuring each state as a fraction of that substance's own critical values, and the data for nitrogen, methane, carbon dioxide, water and a dozen others collapse onto very nearly a single chart. This is the principle of corresponding states: two substances at the same reduced conditions are in mechanically similar states. The generalised chart built from it is good to a few per cent for most gases, and worst for strongly polar or hydrogen-bonded ones, water and ammonia included.
The rule of thumb then becomes concrete. is within one per cent of unity when is below about at any temperature, or when is above roughly and the pressure is not extreme. Room-temperature air is safe on both counts, with and, at atmospheric pressure, . Steam near its own saturation line satisfies neither.
Example. Superheated steam at kPa and degrees Celsius is tabulated at m³/kg. Compute and decide whether the ideal-gas model is safe here.
With kJ/kg K and K, the ideal value is m³/kg, so . The error is under one per cent: fifty degrees of superheat is enough to make the ideal gas model acceptable for this steam.
Now you. Superheated steam at kPa and degrees Celsius is tabulated at m³/kg. Compute and decide whether the ideal-gas model is safe here.
Answer
m³/kg, so . The error is per cent, so this close to the saturation line the ideal gas model is already marginal, and it only gets worse at higher pressure.
Van der Waals, and what one equation can buy
In his doctoral thesis, Johannes Diderik van der Waals asked what minimal repair to would let a gas condense, and made two corrections on physical grounds. First, molecules have size, so the volume available for them to move in is not but , where is roughly the volume the molecules themselves occupy. Second, a molecule about to strike the wall is pulled back by its neighbours behind it, so the measured pressure is less than the ideal one. That pull scales with the density of the pullers and with the density of the pulled, so it goes as . Together:
The two constants are fixed by a neat observation: at the critical point the critical isotherm has both a zero slope and an inflection, so and both vanish there. Imposing that gives and , so the constants come from two measured numbers per substance and nothing is fitted to the bulk of the data.
Qualitatively the payoff is large. Below the critical temperature the equation is a cubic in with three real roots at a given pressure, the smallest a liquid-like volume and the largest a vapour-like one, so a single algebraic expression now contains both phases and predicts condensation. That is genuinely more than the ideal gas can do.
Quantitatively it is poor. The same critical-point conditions force the equation to predict a critical compressibility factor of exactly for every substance, whereas the measured values cluster near to for simple gases (nitrogen is ) and reach down to for water. An equation thirty per cent wrong about the point it was calibrated on is not trusted for design work, and it is not used for any.
There is one further embarrassment. The middle root of the cubic makes the subcritical isotherm double back, so that over a range of volumes is positive: compressing the fluid would lower its pressure, which is mechanically unstable and does not happen. James Clerk Maxwell repaired it in by replacing the loop with a horizontal line drawn so that the two areas it cuts off are equal, a construction later shown to follow from equality of the Gibbs function in the two phases. That flat line is the saturation pressure, and the dome is recovered from theory. The equation explains why the dome exists; the tables say where it lies.
Nothing in this lesson said which direction a process runs. The tables would happily let a lukewarm vessel spontaneously separate into ice and steam, and the First Law would not object either. Finding the principle that forbids it is the work of the next lesson.